What is Clustering?
Density-Based Spatial Clustering of Applications with Noise (DBSCAN) has been a popular clustering algorithm that has stood the test of time. Introduced in 1996, its density-based approach to clustering has ensured its relevance as a solution for patterns that more traditional centroid approaches cannot cluster.
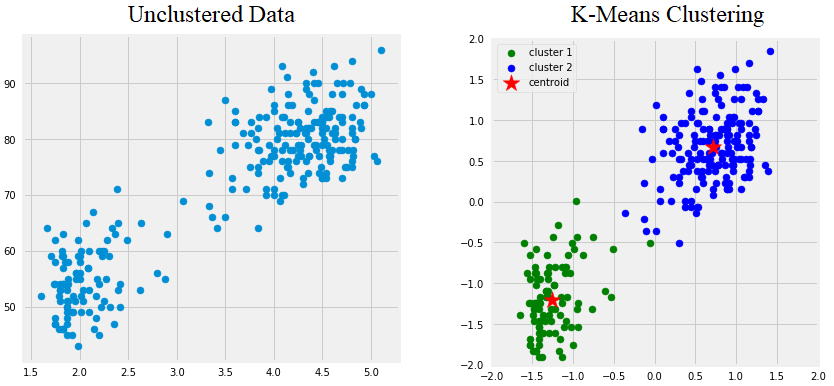
To understand the significance of DBSCAN, a solid grasp of clustering problems is required. Clustering refers to methods that look at data points and group them in some manner. A common and intuitive approach to this problem is to use centroid-based clustering. This algorthim can be easily understood with the figure below which depicts a popular clustering algorithm called “K-Means”. At the basic level, centroid clustering works by guessing many groups the points fall into, and then letting a computer group points by minimizing the distance between each point and the center of its cluster (the centroid).
Unfortunately, methods like these have a few shortcomings. For example, what happens if you don’t know how many clusters there should be? What happens if the points follow a pattern that can’t be made using centroids? What about outliers that shouldn’t be placed in a cluster? The figure below illustrates a few different patterns where K-means succeeds or fails to create good clusters.
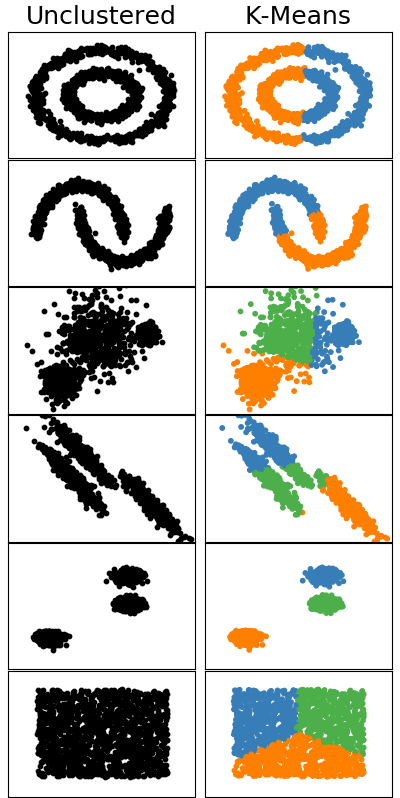
Why does K-means fail to cluster some of the patterns? Centroid clustering algorithms cannot handle patterns where clusters can’t be linearly separated. For example, there is no series of lines that can separate two concentric circles. This means we need a fundementally different approach if we want to cluster these types of patterns. Enter DBSCAN.
The DBSCAN Algorithm
Instead of using the distance between points and centroids, DBSCAN uses the distances between the points themselves. The algorithm follows thesee general steps:
-
Pick an arbitrary starting point and looks for neighboring points.
-
If there are very few or no nearby points, then that point is labeled as noise.
-
If there are many nearby points, then mark the group as a cluster.
-
Check each nearby point and sees if they have neighboors.
-
If they do have neighbors, then the cluster is expanded.
-
Repeatedly grow the cluster until the poimts do not have enough neighbors to grow the cluster.
-
Then choose a different starting point and repeat the process.
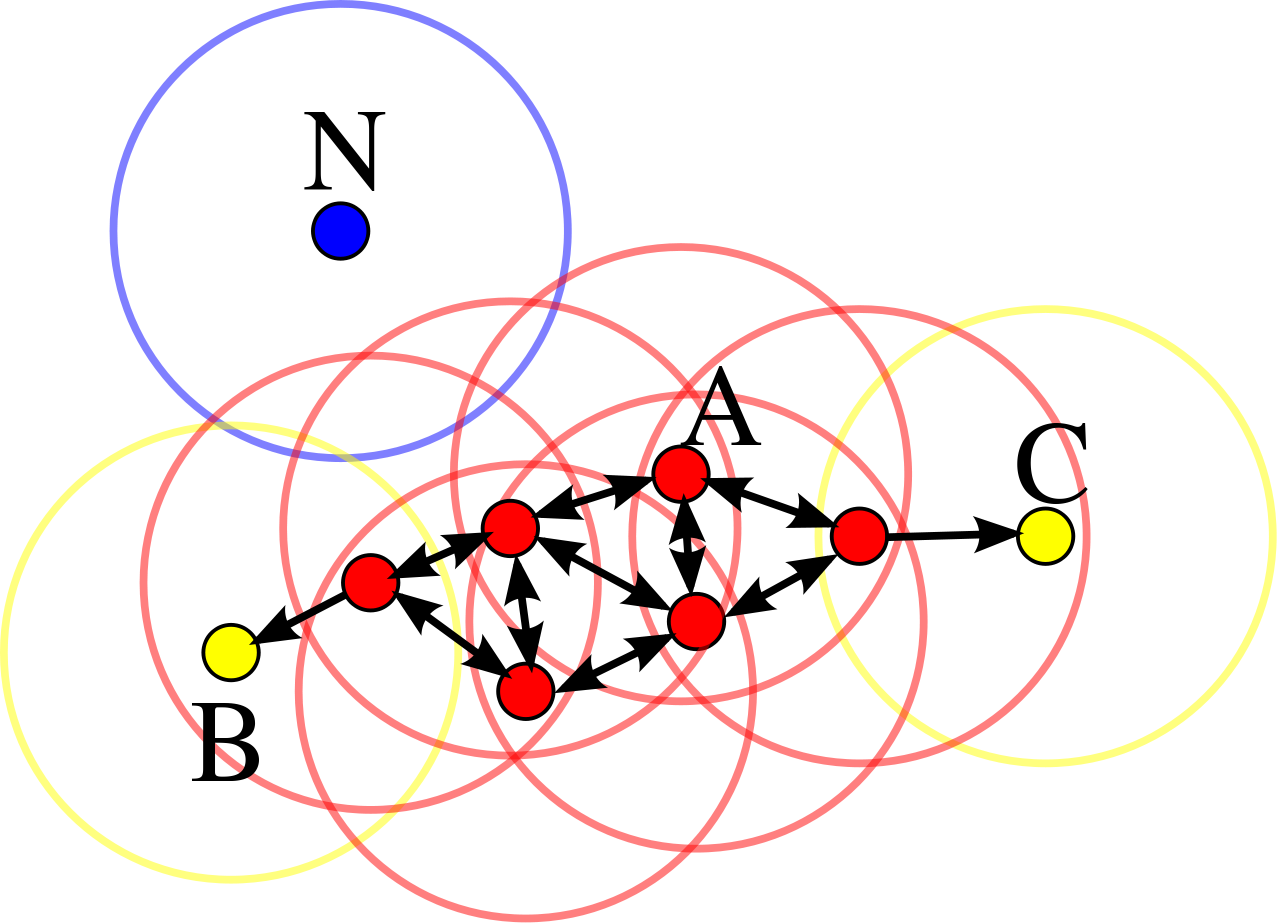
Below is an image depicting the DBSCAN algorithm on a small data set with 1 cluster of points and 1 noise point. Notice that regardless of which point the cluster starts from, it will continually expand until it reaches points B and C. What do you think the circles represent?
The steps outlined above contain almost everything you need to implement a DBSCAN algorithm. The final piece of information needed is to define what “many nearby points” means. In other words, what’s the threshold for whether or not a point has enough neigbhors to be considered a cluster?
Epsilon and Minimum Number of Points
To answer this question the 2 parameters are used, epsilon and a minimum number of points. Epsilon is the max distance 2 points can be away from each other. The higher the value, the more spread out points can be and still count as a cluster. Minimum number of points is simply the threshold for how many connections are needed for a point to grow a cluster. A higher value here means that points more neighbors to count as a cluster.
Basically, DBSCAN looks at point density to determine whether or not to create and grow a cluster. Density has 2 components, the amount of stuff in a space and the size of the space. Epsilon represents the size of the space. So a high epsilon means a low density requirement. The minimum point threshold represents the amount of stuff. A high threshold means a high density requirement.
How effective is DBSCAN?
So how effective is DBSCAN? Let’s see how it handles the same patterns we tested K-means on.
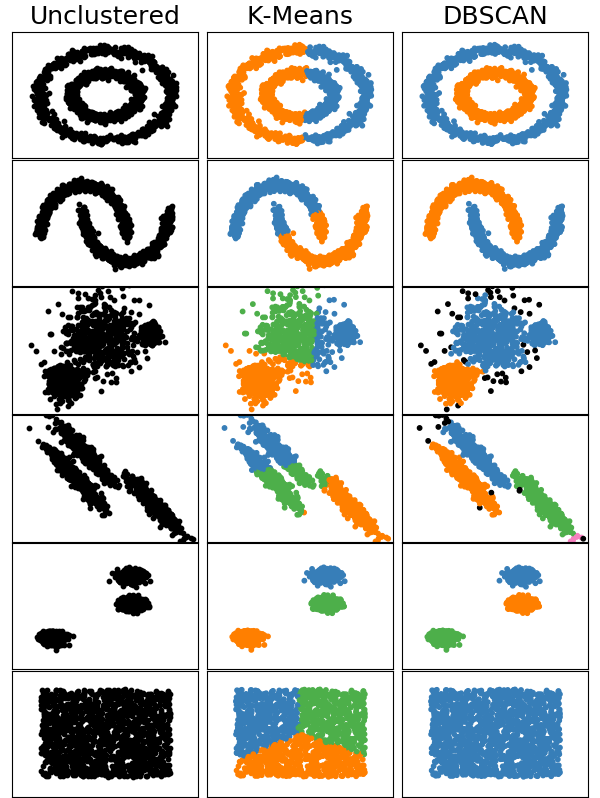
As we can see, DBSCAN does a much better job of clustering many of the patterns. Not only did it correctly label the clusters separated by curved bounaries, but it also marked outliers as noise.
Basic Python Implementation
Now that we understand how DBSCAN works, let’s take a look at code for implementing it. This is code I wrote as a project for understanding and implementing DBSCAN on my own using only basic python and the numpy module.
I create a DBSCAN class to act as an object for our model. This lets us store and access information like epsilon, minimum number of points, and the array of data points. Data point values and their cluster labels are stored within a Cluster object I wrote for this project. The object simply links an array of points to a list of their corresponding labels (i.e. the value and cluster label for any point can be accessed with the same index value).
Create our DBSCAN model class
```python import numpy as np from Cluster_class import Cluster class DBSCAN(): """ Class object for storing our DBSCAN model. The cluster argument stores data points and cluster labels. The optional noise argument let's us specify the noise label. """ def __init__(self, epsilon=0.5, min_points=5, cluster = Cluster(), noise = -1): self.epsilon = epsilon self.min_points = min_points self.cluster = cluster self.noise = noise ```Helper function for calculating the distances between 1 point and the rest of an array
```python def get_distances(self, point, arr): """ Given a point and an n x m array, calculate the distance between that point and every other point in the array Record the distances in a new n x 2 array. [n, 0] contains the distance value. [n, 1] is 1 if the distance is less or equal to epsilon (is a connection) and 0 otherwise. Returns a tuple where the first entry is the array of distances and the second is the number of connections """ # Create an empty array with the same number of rows as our input array. # The first row entry will contain the distance between the input point and all other points. # The second row entry is 0 if the point is not a neighbor or 1 if it is. distances = np.zeros((len(arr), 2)) neighbors = 0 for i in range(len(arr)): # calculate distance and store it in the array dist = np.linalg.norm(point - arr[i]) distances[i, 0] = dist # Mark the point as a neighbor if it's within epsilon distance if dist <= self.epsilon: distances[i, 1] = 1 neighbors += 1 return distances, neighbors ```Helper function for growing a cluster
```python def create_cluster(self, point, arr, cluster, c): """ Recursively grow a cluster given a starting point, an array, a max distances, and a minimum number of points. Modifies the input cluster object by setting all points within the cluster to c. """ distances, connections = self.get_distances(point, arr) # Every time we call this function, we add the point to the cluster cluster.set_label(point, c) # Recursion base case, we have run out of connecting points (reach a terminating point/leaf) if connections == 0: return # If we are not at base case: # Continue jumping to connecting points and labeling them c. # Each time we jump, we shorten the input array by # removing the connecting points from the input array. # Filter the array down to only connecting points # We use the fact that the indices for arr and distances correpsond to the same points connecting_points = arr[ distances[:,1] == 1 ] # We generate the new input array. # This is the array of points minus the connecting points (includes the original point itself) # We must subtract all connecting points instead of just the inpout point to prevent points from # connecting back and forth with each other new_arr = arr[ distances[:,1] == 0 ] # For each connecting point, we recursively call this method to expand the cluster for p in connecting_points: self.create_cluster(p, new_arr, cluster, c) return None ```Method for running DBSCAN on an array
```python def fit(self, arr): """ Fit an array of data points on our DBSCAN object. Stores data points and assigns each point a cluster label or noise label using the DBSCAN algorithm. """ self.cluster = Cluster(arr) Cluster_num = 1 for i, point in enumerate(arr): # If the point has already been assigned a cluster or marked as noise, skip it if self.cluster.labels[i] != 0: continue # Get the number of points that are considered connected (within epsilon distance). _, connections = self.get_distances(point, arr) # If number is less than the min_point threshold, we label it as noise. if connections < self.min_points: self.cluster.labels[i] = self.noise continue # If number is greater than or equal to the threshold, we grow a cluster. else: self.cluster.labels[i] = Cluster_num Cluster_num += 1 # create cluster starting from the given point self.create_cluster(point, arr, self.cluster, Cluster_num) return self ```Verifying the Basic Implementation
We can verify whether or not the above code is a functioning implementation of DBSCAN by comparing it to the SKlearn implementation. Scikit-learn (also known as sklearn) is a machine learning library commonly used by data scientists.
For the comparison, the same patterns from above are used. However, the number of samples has been heavily decreased (from 1,500 to 100) to make the data points less dense. This was done to force the creation of more clusters and better highlight differences between the implementations.
In addition to visualizing the cluster results, the runtime for generating the model from the input data is displayed.
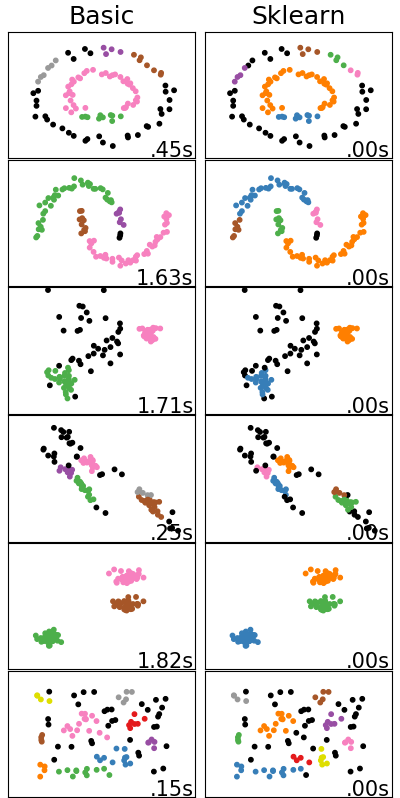
As we can see, even with the significantly less dense data, the clustering done by both algorithms is almost the same. Our basic implementation created 5 instead of 6 clusters for the concentric circles (first row) and 4 instead of 5 clusters for the half moons (second row). What is perhaps more significant is that the runtime for our basic implementation is significantly higher than sklearn’s. Both of these differences are likely due to differences in the distance calculations. Optimizing our current code and utilizing additional search techniques like KD Trees or squared Euclidean Distances would likely reduce or remove the differences.
When to Use DBSCAN?
Now that we understand what DBSCAN is and how to implement it, our final question is when to use DBSCAN. Recall that DBSCAN uses epsilon and a minimum point threshold to mark high density regions as clusters and low density regions as outliers. This is great when:
- High and low density regions are what separates your data set.
- You need to account for outliers.
- You don’t know the number of clusters.
However, this is not good when:
- Adjacent clusters have similar density. If 2 clusters of similar density have a thin trail connecting them, DBSCAN will mark them as a single cluster.
- Cluster density vs. noise density is not consistent. Because epsilon and the minimum point threshold are fixed, DBSCAN cannot handle datasets where the difference between noise and cluster density changes. This problem is addressed by OPTICS, a similar algorithm developed by some of the creators of DBSCAN.
- The faster speed of alternatives like K-Means is needed.
- The required values for epsilon and minumim points can’t be eaasily determined.
All of my code for this project including the Cluster class and the code for generating plots can be found in my repository here.
References:
- Background information on K-Means: https://towardsdatascience.com/k-means-clustering-algorithm-applications-evaluation-methods-and-drawbacks-aa03e644b48a
- Visualization of the DBSCAN Algorithm: https://www.naftaliharris.com/blog/visualizing-dbscan-clustering/
- Background information on DBSCAN: https://medium.com/@elutins/dbscan-what-is-it-when-to-use-it-how-to-use-it-8bd506293818
- Comparison Plot of Various Clustering Algorithms: https://scikit-learn.org/stable/auto_examples/cluster/plot_cluster_comparison.html#sphx-glr-auto-examples-cluster-plot-cluster-comparison-py
- Scikit-learn’s DBSCAN code: https://github.com/scikit-learn/scikit-learn/blob/fd237278e/sklearn/cluster/_dbscan.py#L150